Introduction
A brief description of RAK Ceramics Bangladesh Ltd.
Name of the company
|
:RAK
Ceramics Bangladesh Ltd.
|
Date
of incorporation
|
: November 26, 1998
|
Commencement of Business
|
: 12 November 2000
|
Authorized Capital
Pre- IPO paid-up Capital
IPO size
|
: Tk.3,000 mn
: Tk. 1,855.64 million
: Tk. 300 million.
|
Face
Value
Indicative
price
Nature
of Business
|
: Tk.
10
: Tk.
40
: The Company is engaged in manufacture and
sell of tiles and sanitary
ware.
|
Turn Over (sales)
Profit after tax
EPS (Basic)
|
:Tk.3,247.99mn for year ended on the 31.12.08. and Tk.1910.35 for
last 6 (six ) month as on 30.06.09.
: Tk. 286.4 mn for the
year ended on 31.12.08. and Tk.142.46 for last 6 (six ) month as on 30.06.09
:Tk. 10.99
|
Short term and long term loan from different Banks
Investment in Subsidiary Companies
Share Money deposit
|
: Tk. 1220.45 mn.
: Tk. 362.66 mn
: Tk.558.84 mn
|
Major Product
Issue Manager
Auditors
|
: Tiles and sanitary ware
: IDLC Finance Ltd
& Equity Partners Ltd.
|
RAK Ceramics (Bangladesh) Limited, a
UAE-Bangladesh joint venture company, was incorporated in Bangladesh on 26
November, 1998 as a private company limited by shares under the Companies Act
1994. The name of the Company was thereafter changed to its name from RAK
Ceramics (Bangladesh) Private Limited to RAK Ceramics (Bangladesh) Limited on
10 June 2008, certificate issued by the Registrar of Joint Stock Companies
dated 11 February, 2009.
It is engaged in manufacturing and
marketing of ceramics tiles, bathroom sets and all types of sanitary ware. It
has started its commercial production on 12 November 2000. The commercial
production of new sanitary ware plant was started on 10 January 2004. Further
expansion of the existing facilities of ceramics tiles plant took place in year
2004, and for tiles and sanitary plants were in year 2007.
RAK
Ceramics (Bangladesh) Limited, 90% held by RAK Ceramics PSC, a company incorporated
under the laws of UAE and remaining 10% owned by local investor Mr. S.A.K.
Ekramuzzaman.With an annual turnover of over BDT 3248 million, within the short
span of eight years RAK has firmly established itself as one of the leading
manufacturer of high quality ceramic wall, floor tiles, gresporcellanato and
sanitary wares products in Bangladesh.
Specializing in high-quality ceramic
wall and floor tiles, GresPorcellanato, and sanitary ware, RAK Ceramics uses
more than 8,000 production models, with new designs added almost every week to
its portfolio. Tiles are manufactured in a variety of sizes.
RAK
Ceramics is the world’s first company to launch Luminous, the wonder tile that
glows in the dark and the Antimicrobial, a super specialty tile for the
hospitality industry. The company's creations include the high-valued brand
"Elegance Ceramics" and it continues to be a global pioneer in the
world of ceramics through innovative eco-friendly products such as RAK SLIM,
Stone Art Collection, Orion Collection and Wood Art Collection using the latest
Nanopix digital printing technology. It has also launched its trendy tiles in
unique sizes of 25x70 and 20x50 appealing to the urban consumers. Further it
has tapped children tiles segment with the launch of Junior Tiles Collection.
The
global production of tiles exceeds 360,000 sq.m. and 12,000 pieces of sanitary
ware per day from its 10 state-of-the-art plants in UAE and 1 plant each in
China, Sudan, Bangladesh, India and Iran. RAK Ceramics manages around 8,000
employees in UAE and 12,000 employees worldwide and currently exports to more
than 160 countries, which is a testimony to its excellent reputation worldwide.
RAK Ceramics has recently achieved the status of supplying 1 billion sq.m. of
tiles and 50 million pieces of bathware worldwide and it is the fastest
ceramics manufacturer to achieve the milestone since its inception within two
decades.
RAK
Ceramics is a ISO 9001 : 2008 & ISO 14001 : 2004 certified organisation. In
2007, it was given an AA rating and was ranked among the top four brands in the
UAE by UK-based Brand Finance Middle East. RAK Ceramics was also recognised as
Company of the Year in 2004 by the Arabian Business Awards and bestowed the MRM
Business Award for Manufacturing, the highest manufacturing award of the UAE.
RAK
Ceramics was also honoured by the Emirates Securities and Commodities Authority
(ESCA) for complying with good governance and transparency according to best
international practices.RAK Ceramics won the Innovation Award for its
revolutionary RAK Slim tiles. RAK Ceramics was also honoured with the Best
Brand Award. It has achieved the Environmental Performance Certificate (EPC) in
recognition of its successful efforts to comply with environmental protection
standards and regulations. RAK Ceramics is the first ceramics manufacturing
company in the region to produce GRI-based sustainability report.
RAK
Ceramics offers a complete solution with its diversification into tile
adhesives and grouts in a joint-venture with Laticrete International Inc of USA
to form Laticrete RAK; a joint venture with German-based Kludi to manufacture a
range of taps, faucets and other accessories for sanitary-ware products under
the brand name Kludi RAK; eco-friendly paints under the brand RAK Paints and
RAK Porcelain, the tableware range of products targeted at high-end hospitality
industry. All these subsidiaries contribute to RAK Ceramics brand by offering
complete value-added service to clients.
The Products of RAK Ceramics company :
RAK Ceramics Ltd. Produces a wide range of products such as
Ceramic Wall and Floor Tiles, Decors and Boarders. It also produces an
extremely wide range of products in GresPorcellanato in several finishes suited
for any ambience.
The products of RAK Ceramics company are given below :
Wall tiles
|
Floor tiles
|
Sanitary ware
|
Ceramics
|
Ceramic-GresPorcellanato
|
Model wise
bathrooms set
|
Décor tiles
|
Salt and
Paper(Glaze)
|
Over counters
|
Border tiles
|
Salt and
Paper(Homogeneous)
|
Under counters
|
Wall tiles
matching with Decors and Borders
|
Soluble
Salt(Mirror Polish)
|
Wall mounted wash
basins
|
Double
charge(Mirror Polish)
|
Other accessories
|
|
Wooden model
|
Asian water closet
|
|
Stair and pavement
|
Wash basin
pedestal
|
|
Slate and Rustic
|
Urinal Bow
|
Market Share and Dividend Policy of
RAK Ceramics Bangladesh Ltd :
Authorisedcapital
: 6,00,000,000 ordinary shares of Taka 10 (upto 2012)
Issued,
subscribed, called and paid up :
278,388,935
ordinary shares of Taka 10/- each.
Dividend
Policy :
The Board of Directors of the Company is pleased to recommend dividend
15 percent in cash and 10 percent in stock of the paid up capital of the
Company for the year 2012. Previous year dividend was paid at 15percent in cash
and 10 percent in stock. They
have adopted Dividend Discount Model (DDM) for valuing the share of RAK. The valuation is based on the forecasted
earnings and dividend payments of the
company prepared by RAK Ceramics (Bangladesh) Limited.
.
Marketing Mechanism and Distribution of the
Products :
RAK ceramics is currently leading the company
strategically to position rak ceramics as a premium international brand known
for its innovative product range through technological advancement and
high-quality production. RAK ceramics has invested heavily in research and
development as innovation is the key factor for the company’s sustainable
success as it continues to add new designs and models on a frequent basis to
cater to different markets. It has
sustainable growth plan. With its state-of-art plants and distribution network
and diversified range of products, rak ceramics will continue to exploit new
opportunities for growth and expansion. RAK ceramics offers a complete interior
solution with its diversification into tile adhesives and grouts in a joint-venture
with laticrete international inc of usa to form laticreterak; a joint venture
with german-based kludi to manufacture a range of taps, faucets and other
accessories for sanitary-ware products under the brand name kludirak;
eco-friendly paints under the brand rak paints and rak porcelain, the tableware
range of products targeted at high-end hospitality industry .RAK company always
try to go close to their clients by listening to their needs and adapting to
market requirements excellence in producing high-quality products that offers
best value-for-money redefining the product innovation and design process
accountable to its clients, trade partners, stakeholders and employees motivate
to develop them into future entrepreneurs, integrity of the management towards
the organisational goals committed to the society by contributing towards a
healthy environment.
INDUSTRY ANALYSIS
Porter’s
five forces model identifies the following factors which affects an Industry’s external environment.
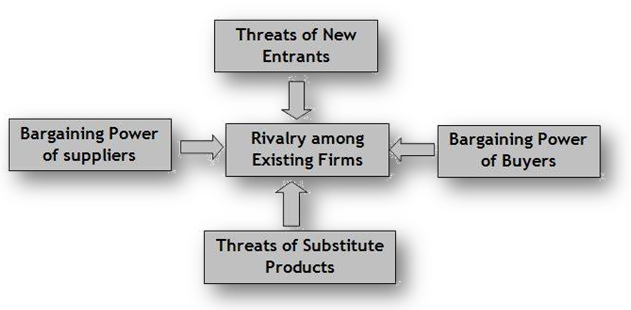
Figure :
Porter’s five forces model
Understanding
these competitive forces and their underlying causes reveals the roots of an industry’s
current profitability while providing a framework for anticipating and
influencing competition (and profitability) over time (Porter 2008). Porter
argues that the stronger each of these forces is,the more limited is the
ability of established companies to raise prices and earn greater return.
Within Porter’s framework, a strong competitive force can be regarded as a
threat since it depresses profits. A weak competitive force can be viewed asan
opportunity, for it allows company to earn greater profits. The strength of
these five forces may change through time as industry conditions change profits
.The analysis of five forces indicates
that the collective impact of the competitive forces is moderate to weak;
hence, the ceramic industry of Bangladesh is considered to be competitively
attractive in the sense that industry members can reasonably expect to earn
decent profits and a nice return on investment.
Risk
of Entry by Potential Competitors
Normally companies
that are not currently competing in an industry, but have the capability of
doing so are known as potential competitors. Bangladesh has certain competitive
advantages in the international market in terms of availability of gas, cheap
labor and the generalized system of preferences (GSP) that allows Bangladesh to
have duty-free exports to Europe and there is no quota restriction either on
the export. Considering this sector’s potentiality for investment, ceramic
industry has always allured both local and foreign investors. Since domestic
and export demand for ceramic products are rising rapidly, widening the gap
between demand and supply, the new entrants can easily expect to earn
attractive profit by capturing the untapped demand. As the construction
industry including residences, shopping malls and others is growing so fast,
the ceramic tiles business is becoming one of the booming and prospective sectors.
In this sector, there are low entry barriers as the government regulations are
supportive for new entrants. However, the number of new entrants and their
capacity development is low compared to the growth in domestic and export
demand. Hence, the competitive threat of potential entry is not strong enough
to place significant competitive pressure on RAK Ceramics Bangladesh Ltd.
Bargaining
Power of Buyers
RAK Ceramics Bangladesh Ltd has got different types of
customers. They are both domestic customers and foreigncustomers. The individual
buyers mostly pay the seller’s posted price. However, itis relatively easy for
buyers to switch to comparatively low-priced imported ceramic goods; keeping
this in mind, the RAK Ceramics industry is aiming for competitive pricing to
attract and retain customers. As a result it has low bargaining power in local
industry. The bargaining power of international buyers is reasonably strong
enough to negotiate for price concession and favorable terms. But due to
increased production cost, other low price supplier countries are also failing
to offer competitive prices and losing their share in the international market.
Thus, more international buyers are moving towards Bangladesh as it has cost
competitiveness in terms of gas supply, cheap labor cost, skilled labor and
also has competitive advantage of possessing “bone china” technology. As the
number of buyers, both in local and international market, is growing, the
bargaining power of buyers is weakening for RAK Ceramics industry.
Threat of Substitute Products
The RAK ceramic
industry is already in fierce competition with low-priced sanitary ware, tiles
and table wares, mostly imported from China. Besides, it is also facing strong
competitive pressure from firms in other industries offering substitute products
such as low priced melamine wares, aluminum wares, steel kitchen wares, glass
wares and plastic wares etc. In recent years, large scale manufacturers have
entered the crockery market, with their brands competing strongly with both
local ceramics products and foreign products of their same kind. Companies like
Bangladesh Melamine, Sharif Melamine, RFL, BRB, and GAZI are contributing
greatly to this thriving crockery market by creating demand for new products.
Other substitutes of tiles include wooden flooring or tiles, bamboo flooring,
ply board, marble stones and other artificial stones for both interior and
exterior usage. Hence, the availability and low cost ofsubstitutes is exerting
moderately competitive pressure on RAK Ceramics Bangladesh Ltd.
The
Bargaining Power of Suppliers
Normally
suppliers become powerful over an organization when any of the following
situations prevails:
- Product that the supplier sells has few substitutes and is important to the company.
- When the company’s industry is not an important customer to the supplier.
- When suppliers respective products are differentiated to such an extent that it is costly for a company to switch from one supplier to another.
- When to rise prices, suppliers uses the threat of integrating vertically forward into the industry and competing directly with the company.
- When buying companies cannot use the treat of vertically integrating backward and supplying their own needs as a means of reducing input prices.
In
Bangladesh, there is a shortage of raw materials, equipment and machineries for
ceramic industry, it gives the supplier of RAK Ceramics Bangladesh Ltd more
leverage in bargaining the price. But the supplier base is moderately large
enough to weaken the supplier power.
Rivalry
among Existing Firms
The RAK Ceramics
Bangladesh Ltd faces stiff competition. Ceramic manufacturers like Monno
Ceramic, ShienpukurCeramic, Standard Ceramic, FARR Ceramic and Bengal Fine ceramics
are still leading in ceramics industries. All other ceramic manufacturers are
also increasing their production capacity following robust growth in demand for
ceramic ware. However, increment in the number of new plants, capacity
development, product development and market expansion by RAK Ceramic Bangladesh
Ltd made it reducing rivalry among existing firms. As there still exit ample
growth opportunities in this industry, the rivalry among the existing companies
are still weak.
Internal
Environment Analysis
The
RAK Ceramics Bangladesh Ltd’s profit is not stable over last several years. In
this section, attempts will be made to identify the causes and the sources of competitive
advantages of RAK Ceramic company.
RESULTS OF
INDUSTRY ENVIRONMENT ANALYSIS
Understanding
industry structure for RAK Ceramics Bangladesh Ltd is of great concern to
strategist since defending against the competitive forces and shaping them in a
company’s favor are crucial to strategy. Besides, it is also essential for
effective strategic positioning of a company. This analysis will help RAK
Ceramics Bangladesh Ltd. to decide how to influence or to exploit particular characteristics
of the ceramic industry. The analysis of porter’s five forces model indicates
that the industry environment of ceramic sector is weak to moderate competitive
and offers ample growth opportunities for both its incumbents and new entrants.
As the collective impact of the five competitive forces is moderate to weak,
the ceramic industry is considered to be competitively attractive in the sense
that industry members can reasonably expect to earn decent profits and a nice
return on investment. Therefore, to sustain in this industry, the RAK ceramics companies
should match strategy to prevailing competitive conditions of the marketplace.
These strategies should include actions such as continuous productdevelopment,
quality improvement and offering ranges of prices to satisfy allsegments of the
domestic and export market.
Identification of Red Flags & Estimating Earnings
Quality
|
Potential Red Flags Identification:
A very common approach to accounting
quality analysis is to look for “ red flags” pointing to questionable
accounting quality. These indicators
suggests that the analyst should examine items more closely or gather information
on them.
Some common types of red flags are:
1)Unexplained changes in accounting
especially when performance is poor.
2) Unexplained transactions that
boost up profits.
3) Unusual increase in accounting
receivable in relation to increase in sales.
4) Unusual increase in inventories in
relation to sales increase.
5) An increasing gap between a
firm’s reported income and its cash flow
from operating activities.
6)
An increasing gap between a firm’s reported income and its tax income.
7) A tendency to use financing mechanism like research and development
partnership and the sale of receivables
with recourse .
8) Unexpected large assets write
off.
9) Large fourth quarter adjustments.
10) Qualified audit opinions or
changes in accounting auditors that are not well justified.
11) Related party transactions or
transactions between related parties.
Identified Red
Flags of RAK CeramicsBangladesh Limited
:
I became able to identify the following two red flag of RAK Ceramics
Bangladesh Limited and gathered information about their origination-
1)
An
unusual increase is accounts receivables in relation to increase in sales is
traced in the year of 2010.
From the above table we can see that sales increased by only 14.25% in
the year 2011 but accounts receivables increased by 35% in that year. This may
be due to the fact that export sales decreased significantly at that year and
to cover up such decrease the company tried to increase local sales by
increasing credit sales.
I)
Significant
inecrease in cash flows from operations in the year of 2012 while reported
income is decreased significantly.
From the above information we can see that although reported income
has been decreased by 22.05% in the year 2012 cash flows from operations increased
by 74.19% in that year. Cash flows from operations increased because payments
for cost and expenses decreased significantly in that year but still reported
income is showing a negative growth rate.
Estimating Earning Quality of RAK CERAMICS Bangladesh
Limited :Earnings
management is predominantly a function of manipulating accruals, so it is
intuitive to use the magnitude of accruals as a proxy for earnings quality: the
higher the total accruals as a percentage of assets, the greater the likelihood
that earnings quality is low.
There are two approaches for measuring earnings quality-
1) Balance Sheet Approach: Formula = (NOAt
– NOAt-1)/{(NOAt + NOAt-1)/2}
2) Statement of Cash Flow Approach: Formula = {NIt–
(CFOt + CFIt)}/ )/{(NOAt + NOAt-1)/2}
Decision Rule: A high ratio indicates that the companies accrual basis
earnings has a high aggregate accruals component (more management discretion),
which implies low earning quality and vice versa.
Decision (Individual Evaluation):
Using both balance-sheet-based accruals ratio and cash flow
statement based accrual ratios we can conclude that RAK Ceramics Bangladesh
Limited has improved earnings quality from 2010 to 2012.
Analysis of Cash
Flow Statement :

FCF and OCF through graph :
In the following graph of
OCF we can see that OCF is higher in 2010but in 2011 it falls in a significant
amount due to the expansion of the firm in a subsidiary operation and also
due to increase their sale and overall profit.
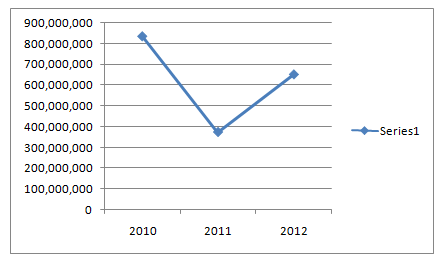
Figure
: Operating cash flow.
In the following graph of FCF, we see that FCF
is is increasing all of the year of 2010, 2011 and 2012.
Figure
: Free cash flow.
|
||||||||||||||||||||||||||||||||||||||||||||||||||||||||||||||||||||||||||||||||||||||
Classification of RAK
CERAMICS BANGLADESH Limited in terms of OCF & FCF:
There are four types of decision that we can take:
OCF
|
FCF
|
Category
|
Positive (+)
|
Negative (-)
|
Growth Company
|
Positive (+)
|
Positive (+)
|
Cash Cow
|
Negative (-)
|
Positive (+)
|
Disinvest/Quit
|
Negative (-) > FCF
Negative (-) <FCF
|
Negative (-)
|
1)Disinvest/Quit
2) BMRE
|
As both Free cash Flow and Operating Cash Flow are positive for RAK
Ceramics Bangladesh Limited for every
year from 20010 to 2012 so the firm can be classified as a cash cow.
Analysis of Cash Flow Trend:
After analyzing the cash flow statement of RAK Ceramics Bangladesh Limited
it is found that although net cash inflows occurred from operating activities
year after year, net cash outflow occurred in investment activities from 2010
to 2012 and in financing activities from 2011 to 2012 for the company.
Cash Flow Trends:
v For analyzing cash flow trend the following
graphs are used-
Figure 01: Net Cash Inflow from
Operating Activities.
Explanation: The above figure
indicates that net cash inflows from operating activities decreased sharply in
the year of 2011. The reason identified is that cash payments for cost and
expenses increased significantly in that year. And then it started increasing
and continued to increase up to 2012.
The
following figure
no.02representsNet Cash Inflow from
Investment Activities :
Figure 02: Net Cash Inflow from Investment Activities.
Explanation: The above figure
indicates that net cash outflows from investment activities increased sharply
from the year of 2011. The reason identified is that cash investment in long
term asset is increased sharply from the year of 2011.
v The following figure
represents the cash outflow from financing activities :
Figure 03: Net Cash Inflow from Investment Activities.
Explanation: The above figure
indicates that net cash outflows from financing activities is increased from
2011 but in the year of 2010 there is cash inflow from financing activities.
Analysis of the performance of the Company
Ratios . . .
Du-pont Analysis
Year
|
O. Profit Margin
|
Total Asset Turnover
|
Interest Burden
|
After tax Retention rate
|
Financial Leverage
|
ROE
|
2012-13
|
0.208745166
|
0.588493423
|
0.952951999
|
0.628500001
|
1.45632672
|
0.10715
|
2013-14
|
0.231163737
|
0.566029405
|
0.96544092
|
0.6285
|
1.493380173
|
0.118566
|
2014-15
|
0.255994241
|
0.542538401
|
0.966350558
|
0.6285
|
1.533108031
|
0.129322
|
2015-16
|
0.283496813
|
0.516760449
|
0.963074422
|
0.66339878
|
1.572867181
|
0.147219
|
2016-17
|
0.313959723
|
0.503259403
|
0.959960378
|
0.695072586
|
1.640742022
|
0.172977
|
Sensitivity
of ROE in respect to operating profit margin-
Year
|
O. Profit Margin
|
Total Asset Turnover
|
Interest Burden
|
After tax Retention rate
|
Financial Leverage
|
ROE
|
% Change in ROE
|
2012-13
|
0.208745166
|
0.588493423
|
0.952951999
|
0.628500001
|
1.45632672
|
0.107150245
|
-
|
2013-14
|
0.231163737
|
0.588493423
|
0.952951999
|
0.628500001
|
1.45632672
|
0.118657842
|
0.107396839
|
2014-15
|
0.255994241
|
0.588493423
|
0.952951999
|
0.628500001
|
1.45632672
|
0.131403501
|
0.107415221
|
2015-16
|
0.283496813
|
0.588493423
|
0.952951999
|
0.628500001
|
1.45632672
|
0.145520749
|
0.107434339
|
2016-17
|
0.313959723
|
0.588493423
|
0.952951999
|
0.628500001
|
1.45632672
|
0.161157558
|
0.107454153
|
MEAN=0.107425138
SD=2.46692E-05
CV=0.000229641
|
|
Sensitivity of ROE in respect to Total Asset Turnover-
Year
|
O. Profit Margin
|
Total Asset Turnover
|
Interest Burden
|
After tax Retention rate
|
Financial Leverage
|
ROE
|
% Change in ROE
|
2012-13
|
0.208745166
|
0.588493423
|
0.952951999
|
0.628500001
|
1.45632672
|
0.107150245
|
-
|
2013-14
|
0.208745166
|
0.566029405
|
0.952951999
|
0.628500001
|
1.45632672
|
0.103060097
|
-0.03817208
|
2014-15
|
0.208745166
|
0.542538401
|
0.952951999
|
0.628500001
|
1.45632672
|
0.09878296
|
-0.041501385
|
2015-16
|
0.208745166
|
0.516760449
|
0.952951999
|
0.628500001
|
1.45632672
|
0.094089426
|
-0.047513599
|
2016-17
|
0.208745166
|
0.503259403
|
0.952951999
|
0.628500001
|
1.45632672
|
0.091631216
|
-0.026126314
|
MEAN=-0.038328344
SD=0.009006498
CV=-0.234982712
|
|
Sensitivity of ROE in
respect to Interest Burden-
Year
|
O. Profit Margin
|
Total Asset Turnover
|
Interest Burden
|
After tax Retention rate
|
Financial Leverage
|
ROE
|
% Change in ROE
|
2012-13
|
0.208745166
|
0.588493423
|
0.952951999
|
0.628500001
|
1.45632672
|
0.107150245
|
-
|
2013-14
|
0.208745166
|
0.588493423
|
0.96544092
|
0.628500001
|
1.45632672
|
0.108554503
|
0.013105509
|
2014-15
|
0.208745166
|
0.588493423
|
0.966350558
|
0.628500001
|
1.45632672
|
0.108656783
|
0.0009422
|
2015-16
|
0.208745166
|
0.588493423
|
0.963074422
|
0.628500001
|
1.45632672
|
0.108288413
|
-0.003390215
|
2016-17
|
0.208745166
|
0.588493423
|
0.959960378
|
0.628500001
|
1.45632672
|
0.107938269
|
-0.003233441
|
MEAN=0.001856013
SD=0.007763411
CV=4.182842526
Sensitivity of ROE
in respect to Financial Leverage-
Year
|
O. Profit Margin
|
Total Asset Turnover
|
Interest Burden
|
After tax Retention rate
|
Financial Leverage
|
ROE
|
% Change in ROE
|
2012-13
|
0.208745166
|
0.588493423
|
0.952951999
|
0.628500001
|
1.45632672
|
0.107150245
|
-
|
2013-14
|
0.208745166
|
0.588493423
|
0.952951999
|
0.628500001
|
1.493380173
|
0.109876478
|
0.025443091
|
2014-15
|
0.208745166
|
0.588493423
|
0.952951999
|
0.628500001
|
1.533108031
|
0.112799483
|
0.026602642
|
2015-16
|
0.208745166
|
0.588493423
|
0.952951999
|
0.628500001
|
1.572867181
|
0.115724789
|
0.025933691
|
2016-17
|
0.208745166
|
0.588493423
|
0.952951999
|
0.628500001
|
1.640742022
|
0.120718728
|
0.043153574
|
MEAN=0.03028325
SD=0.008593368
CV=0.283766382
|
|
DECISION: As CV is higher in case of interest burden, so, ROE is more
sensitive in case of interest burden.
v
Analysis of Sustainable Growth :
Computation of SG :
Computation Between Actual and Sustainable Growth :
The following graphs shows the
actual and sustainable growth comparison of the firm –
Explanation&
Suggestions:
The sustainability growth of RAK Ceramics Bangladesh Limited’s
is lower in 2011 and is higher in 2010 and 2012 than its AG which is a good
sign. It means that the company has the potential of going up growth. In these
cases, management's principal objective is finding productive uses for the cash
flows that exist in excess of their needs. Options available to business owners
and executives in such cases include returning the money to shareholders
through increased dividends or common stock repurchases, reducing the firm's
debt load, or increasing possession of lower earning liquid assets. These
actions serve to decrease the sustainable growth rate. Alternatively, these
firms can attempt to enhance their actual growth rates.
Estimation of Value Addition:
For estimating value addition at first intrinsic value of shares for
RAK Ceramics Bangladesh Ltd and no-growth value is calculated for every year
and then by subtracting no-growth value from intrinsic value present value of
growth opportunity (PVGO) is calculated which is the indicator for value
addition or subtraction.
Here,
Intrinsic value = D1/ (k-g) &
G = ROE*b
No-growth value = E1/ k
PVGO = Intrinsic Value – No-growth value
Explanation of the results:
From the above table we can see
that PVGO is positive and higher for the 2010 & 2011 and in 2012 it is
lower than previous year but positive. These positive growth opportunities
indicate that the growth opportunity actually increases the stock price.
v
Measuring DOL & DFL :
Degree of Financial leverage :
The degree of
financial leverage (DFL) is the leverage ratio that sums up the effect
of an amount of financial leverage on the earning per share of a company. The degree of financial leverage or DFL makes use of fixed
cost to provide finance to the firm and also includes the expenses before
interest and taxes. If the Degree of Financial Leverage is high, the Earnings
Per Share or EPS would be more unpredictable while all other factors would
remain the same.
The
degree of financial leverage or DFL helps in calculating the comparative change
in net income caused by a change in the capital structure of business.This
ratio also helps in determining the suitable financial leverage which is to be
used to achieve the business goal. The higher the leverage of the company, the
more risk it has, and a business should try and balance it as leverage is
similar to having a debt.
ü
From the above discussion we can say
that the DFL of the firm is decreasingslightly year after year but remain
positive throughout the year. That indicates that financial position of the
firm is not good. As the degree of financial leverage is positive so the
earning per share would be more unpredictable for the shareholders of the firm.
ü
Moreover higher the leverage ratio
of the firm, the more risk is in the firm. As leverage ratio of the firm is
positive so the firm need to balance its debt for better financial position.
ü
On the other hand the ratio also
helps the investor to decide which firm to invest in lower risk, with high
profitability. As the ratio is on the side of the firm and bears a bad
indication of higherrisk , so customer may not decide to invest in the firm. So
the firm should try to control the DFL.
Degree of Operating leverage:
The Degree of Operating Leverage (DOL) is the
leverage ratio that sums up the effect of an amount of operating leverage on
the company’s earnings before interests and taxes (EBIT). Operating Leverage
takes into account the proportion of fixed costs to variable costs in the
operations of a business. If the degree of operating leverage is high, it means
that the earnings
before interest and taxes
would be unpredictable for the company, even if all the other factors remain
the same.
A
business would benefit if it can estimate the Degree of Operating Leverage or
DOL. The impact of the leverage on the percentage of sales can be quite
striking if not taken seriously; therefore it is really important to minimize
these risks of the business.
ü
From the above table we see that the degree of
operating leverage of the firm was significantly higher in 2010 and 2011. That
indicates the earning before interest and taxes would be unpredictable even if
the all the others factors remain constant.
ü
On the other hand as
operating leverage is high a small percentage change in sales can increase the
net operating income. For this reason Since
the Degree of Operating Leverage or DOL helps in determining how the change in
sales volume would affect the profits of the company, it is important to
ascertain the value of degree of operating leverage in order to minimize the
losses to the company.
ü
When there is a higher degree of operating
leverage or DOL then the firm should try and balance the operating leverage to
balance with the financial leverage in order to provide with profits to the
company.
v
Comments on Disclosure Practice :
Mandatory Disclosure practices by RAK Ceramics
Bangladesh Limited :
I)
According
to ICAB manual typical annual report must include the followings-
ü Accounting policies;
ü Balance sheet
ü Cash flow statement
ü Profit and loss account
ü Notes to the financial statements
ü Chairpersons statement
ü Directors' Report
ü Operating and financial review
ü Other features Auditors report.
Ø RAK Ceramics Bangladesh Limited
provided a complete set of financial statements in their annual report which
include a statement of financial position, a statement of comprehensive income,
a statement of changes in equity, a statement of cash flows and notes for the
period according to the BAS 1(10).
In
addition annual reports should also disclose the following according to BAS-1:
II)
According
to BAS an entity should disclose the following information prominently-
a) The name of the reporting entity or
other means of identification, and any change in that information from the end
of the preceding reporting period;
b) Whether the financial statements are
of an individual entity or a group of entities;
c) The date of the end of the reporting
period or the period covered by the state of financial statements or noted;
d) The presentation currency; as
defined in BAS 21.
Ø The name of the reporting entity and
other means of identification are followed by RAK Ceramics Bangladesh Limited.
Ø It is also clear from the annual
report that the company is an individual entity. The dates of the end of the
reporting period are covered by the set of the financial statements or notes.
Sample is given in the following page-
RAK CERAMICS
(BANGLADESH) LTD.
Consolidated
Statement of Financial Position
as at 31 December 2012
|
RAK CERAMICS
(BANGLADESH) LTD.
Notes
to the Consolidated Financial Statements
As at and for the year
ended 31 December 2012.
|
v It is also disclosed in the annual
report of RAK Ceramics Bangladesh Ltd. that foreign currency transactions are
recorded at the applicable rates of exchange ruling at the transaction
date.
III)
The
company follows the BAS-1 (54) in completing financial position statement. But
some of the elements are absent.
IV)
According
to BAS-1 (97) When items of income or expenses are material; an entity shall
disclose their nature and amount separately.
Ø Items of income or expense are shown
separately both in the statements and notes by RAK Ceramics Bangladesh Limited.
V)
According
to BAS-1 (98) circumstances that would give rise to the separate disclosure of
items of income and expense include-
a) Write downs of inventories to net
realizable value or of property, plant and equipment to recoverable amount, as
well as reversals of such write-downs.
Ø The write down of inventory by RAK
Ceramics Bangladesh Limited-
|
b)Disposals of items in property, plant and equipment.
Ø Such disposals of RAK Ceramics
Bangladesh Limited are as follows-
Property, plant and equipment are
stated at their cost (Fair value for Building & other construction) less
accumulated depreciation in accordance with IAS 16 as adopted by ICAB as BAS 16
"Property, Plant and Equipment”. Cost represents cost of acquisition or
construction and capitalization of pre-production expenditure including
interest during construction periods. No depreciation is charged on land and
land development. Full year’s depreciation has been charged on additions
irrespective of date when the related assets are put into use. Depreciation on all
other fixed assets is computed using the straight line method in amounts
sufficient to write off depreciable assets over their estimated useful economic
lives.
VI)
According
to BAS an entity shall present statement a statement of changes in equity
showing in the statement:
a) Total comprehensive income for the
period, showing separately the total amounts attributable to owners of the
parent and to non controlling interest;
b) For each component of equity, a
reconciliation between the carrying amount at the beginning and the end of the
period, separately disclosing changes resulting from-
i)
Profit
or loss;
ii)
Each
item of other comprehensive income
iii)
Transactions
with owners in their capacity as owners, showing separately contributions by
and distributions to owners and changes in ownership interests in subsidiaries
that do not result in loss of control.
RAK Ceramics Bangladesh Limited has
followed the above rules of BAS-1 (106).
VII)
According
to BAS-1 (117) an entity shall disclose in the summary of significant accounting
policies:
a) The measurement basis (or bases)
used in preparing the financial statement, and
b) The other accounting policies used
that are relevant to an understanding of the financial statements.
Ø It is mentioned in the annual reports
of RAK Ceramics Bangladesh Limited that the company followed IAS, BAS, IFRS and
BFRS in preparation of financial statements.
Voluntary
disclosure practices of RAK ceramics ltd-
(I) Description about the products the
company manufactures;
(II) The breakdown of shareholding as follows-
Sl. No.
|
Shareholder's Group
|
No.
of Shares
Held
|
%
of Total
Shares
|
o.
of
Shareholders
|
1.
|
Sponsors &
Directors :
I. Local (Individual + Corp. Body)
II. Govt. of Bangladesh
III. Foreign
(Individual + Corp. Body)
|
18,556,374
N/A
201,578,626
|
6.67
N/A
72.41
|
1
N/A
8
|
2.
|
Associated
Companies
|
N/A
|
N/A
|
N/A
|
3.
|
Govt. of
Bangladesh
|
N/A
|
N/A
|
N/A
|
4.
|
Corporate Bodies
I. Local (other than in sl no. 1)
II. Foreign
(other than in sl. no. 1)
|
27,232,564
500
|
9.78
0.00
|
490
1
|
5.
|
General Investors
I. Local Individual
II. Non Resident Bangladeshis (NRBs)
III.Foreign
Individual
|
30,293,766
727,105
N/A
|
10.88
0.26
N/A
|
58,617
2,130
N/A
|
6.
|
Total
|
278,388,935
|
100.00
|
61,247
|
Choice of
Accounting Policies by RAK Ceramics Bangladesh Limited-
Some crucial accounting policies by RAK
Ceramics Bangladesh Limited are discussed below-
1) Recognition
of Income:
According to BAS-18 ‘Revenue’, Vat as included in sales price and collected on
behalf of customers is not considered as ‘Revenue’.
2) Property,
Plant and Equipment:
these are initially stated at cost of acquisition and subsequently stated at
cost less accumulated depreciation in accordance with BAS 16. Any kind of
repair and maintenance is charged off as revenue expenditure in the period when
it is incurred. But if it is clearly demonstrated that the expenditure has
resulted in an increase in future economic benefit expected to be obtained from
the use of fixed assets, then the expenditure is capitalized as an additional
cost of assets.
3)
Depreciation:Items
of property, plant and equipment are depreciated on a straight-
4)
line basis in profit or loss over the estimated useful lives of each
component. Capital work-in-progress and land are not depreciated. Depreciation
on addition to fixed assets is charged from the day of their acquisition and
charging of depreciation on property, plant and equipment ceases from the day
on which the deletion thereof takes place. Depreciation continues to be charged
on each item of property, plant and equipment until written down value of such
fixed asset is reduced to Taka one.
4)R & D Expenses: Development
costs are expensed when incurred instead of recognizing as an asset due to the
uncertainty of the related future economic benefit.
5) Advertising
and Promotional Expenses: All costs associated with advertising and promoting
products are expensed in the year incurred.
6)
Inventories:Inventories
on hand are valued at the lower of cost and net realisable value. For raw
materials and consumable spare parts cost is determined on a weighted average
cost basis. Work-in-process is stated at cost to complete of respective
product. Cost comprises cost of raw materials, wages and other overheads up to
the stage of completion. Finished products are stated at lower of cost and net
realisable value. Net realisable value is the estimated selling price in the
ordinary course of business less the estimated costs necessary to make the
sale. Raw materials in transit are valued at cost.
7)
Lease:
Leases for which the Company assumes substantially all of the risks and rewards
of ownership are classified as finance leases. On initial recognition, the
leased asset is measured at an amount equal to the lower of its fair value and
the present value of minimum lease payments. Subsequent to initial recognition,
the asset is accounted for in accordance with the accounting policy applicable
to that asset.
8) Taxes :
Current tax is the expected tax
payable on the taxable income for the year, using tax rates enacted or
substantially enacted at the reporting date, and any adjustment to tax payable
in respect of previous year. Provisions for corporate income tax is made
following the rate applicable for a publicly-traded company.
Deferred
tax has been recognised in accordance with Bangladesh Accounting Standard (BAS)
12. Deferred tax is provided using the liability method fortemporary
differences between the carrying amount of assets and liabilities for fi
nancial reporting purposes and the amount used for taxation purpose.Deferred
tax is determined at the effective income tax rate prevailing at the reporting
date.
Off Balance Sheet Items for RAK Ceramics Bangladesh
Limited-
The
only off balance sheet item for the company is Leased asset.
Economic Characteristics
& Strategies
|
Economic characteristics of a business can be easily
identified and evaluated using Structure Conduct Performance Analysis or SCP
Analysis.
The Structure-Conduct-Performance (S-C-P) paradigm of
strategy assumes market structure would determine firm conduct which would
determine performance. This is a paradigm that is foundational to industrial
organization economics, consistent with the positional view of strategy, as
opposed to the resource-based view of strategy.
This
model can be used to justify consolidation in the industry. If Structure drives
Performance, one way to improve performance is to create a more attractive
industry Structure. This analysis is similar to the competitive intensity
dimension of Porters 5 forces analysis.
The
usefulness of this model is diminished when industry boundaries are blurred and
primary threats are coming from outside the industry.
S-C-P
analysis framework:
Highlight in Structure
:
- Industry concentration – from monopoly to perfect competition?
(Ceramics
industry is not perfectly competitive in our country).
- Market share pattern – is there a dominant leader?
(
RAK ceramics has high market sharein this industry share relative to others and
it is a domonent leader firm).
- What is the Minimum Efficient Scale?
(
As the market pattern is competitive so a small change in price specially based
on better quality with newer design is efficient scale in this industry.)
- Ownership of major companies (if they are listed/family/state-owned)
( Most of
the companies in this industry are listed in DSE. Owners are sponsors
directors, general investors, non-resident Bangladeshi and corporate bodies.)
Highligh inConduct :
- Where do they compete? Prices? Service? Advertising investment? War for Talent? Product innovation?
(In Ceramic
industry the firms compete both on prices, service, and product innovation. To
grab the market share with reasonable prices and with cost leadership they
compete with each other on basis innovating new product with new design and
high quality.)
- Is the conduct stable, or is it erratic, linked to the industry cycle?
( Ceramics
industry conduct specially the production, marketing above all customer
satisfaction level is stable on the product quality.)
- Do player try to differentiate, or follow “me-too” strategy?
( As there
is competition to grab the customers for this the players on the field always
try to differentiate themselves with newer quality type ceramics products with
higher quality superior to their competitors.
- Do competitors try to grow the pie (“good competitors”), or fight to enlarge their share (“bad competitors”)?
( Actually
the competitors always try to enlarge their market share as a result they
engage in bad competition. But ceramics companies try to be good competitors
and at the same time try to grab market share).
Highlight in Performance:
- Long term Total Shareholder Returns (TSR)?
(
On the growing stage the total shareholders return is simply lower than any
other industry, because of customer acceptance with the satisfaction after they
use.)
- Return on Capital Employed? (ROCE)
(
ROCE is medium in this industry).
- Economic Profit?
80/20
rule – if we calculate this for the largest companies, our estimate for the industry
will be accurate. If we can’t get the data for some private companies or
divisions, then we will identify the best comparable company and assume the
same profitability and quantify, average over several years to remove the
industry cycle effect.
Policy Implications and
Conclusions
|
Classifying RAK Ceramics Bangladesh Limited using
Boston Consultant Matrix-
The BCG Matrix was developed by Bruce Henderson of the
Boston Consulting Group, a strategic management consulting firm, in the early
1970s, to analyze the performance of products. According to this technique,
business or products are classified as low or high performers depending upon
their market growth rate and relative market share. It is a two-by-two graph,
with market growth shown on the vertical axis and market share charted on the
horizontal axis.
The matrix
places products or business into four categories based on their market share
and market growth. The categories are-

v Dogs:Low
Market Share and Low Market Growth. They often don't make much profit, but they don't need
much investment either. Much of the time, the company may need to offer a price
discount to sell Dog products.
v Cash
Cows:High Market Share and Low Market Growth. These businesses or products are
well established. They're likely to be popular with customers, which makes it
easier for the company to exploit new opportunities. However, the firm should
avoid spending too much effort on these, because the market is only growing
slowly, and opportunities are likely to be limited.
v Stars:High
Market Share and High Market Growth. Businesses and products in this quadrant are seeing rapid
growth. There should be some good opportunities here, and the firm should work
hard to realize them.
v Question
Marks (Problem Children):Low Market Share and High Market
Growth. These
are the opportunities that no one knows how to handle. They aren't generating
much revenue right now, because the company doesn't have a large market share.
But they're in high-growth markets, so they could become Stars or even Cash
Cows if the firm can build market share. However, if the firm cannot increase
market share, Question Marks could absorb a lot of effort with little return.
Application of BCG matrix in perspective of RAK Ceramics Limited :
From the above discussion it can
be decided that RAK Ceramics Bangladesh Ltd is a cash cow firm. Because from my analysis of the corresponding market
share of this firm is almost 60%, while its other competitors market share is
very small amount of each of the firm.On the other hand it is also clear that
its growing rate is higher than its competitor. So, the firm has the
possibility to be star. On the other hand when the firm lost his growth rate it
will turn into as a dog, where it should be shut down.
VRIN MODEL
Applying Barney's (1991) VRIN framework can determine if a
resource is a source of sustainable competitive advantage. The resource-based
view (RBV) is a way of viewing the firm and in turn of approaching strategy.
Fundamentally, this theory formulates the firm to be a bundle of resources. It
is these resources and the way that they are combined, which make firms
different from one another. It is considered as taking an inside-out approach
while analyzing the firm. This means
that the starting point of the analysis is the internal environment of the
organization.
The VRIN characteristics :
The important features for a resource to be
strategically important are as below
§ Valuable - When resources are able to bring value to the firm they can
be a source of competitive advantage.
§ Rare - Resources have to deliver a unique strategy to provide a
competitive advantage to the firm as compared to the competing firms. Consider
the case where a resource is valuable but it exists in the competitor firms as
well. Such a resource is not rare to provide competitive advantage
§ Inimitable - Resources can be sources of sustained competitive advantage
if competing firms cannot obtain them. Consider the case where a resource is
valuable and rare but the competing organizations can copy them easily. Such
resources also cannot be sources of competitive advantage
- Non-substitutable - Resources should not be able to be replaced by any other strategically equivalent valuable resources. If two resources can be utilized separately to implement the same strategy then.
Competency
|
Valuable
|
Rare
|
Inimitable
|
Non-
Sub
|
Conclusion
|
Technology and instrument
|
Yes
|
No
|
No
|
Yes
|
Comp. Parity
|
Innovation of new product
|
Yes
|
Yes
|
Yes
|
No
|
Temp. comp. adv.
|
Specializing in producing high
quality ceramics products
|
Yes
|
Yes
|
No
|
No
|
Sustainable comp. adv.
|
Identify key
competencies and Constructing a VRIN Table:
Application of VRIN model in RAK ceramics ltd :
As RAK
Ceramics Ltd valuable and non substitute instrument and it is able to innovate
new product with new dimension and with higher quality and can capture the
market share with high value brand which is not so easily inimitable by other
ceramic industry and also it has achieved specialization in producing higher
quality new products than any other firms. So, RAK ceramics has sustainable
competitive advantage.
COURCES OF ACTIONS FIRMS NEEED TO TAKE AND THE POLICY
SHOULD BE IMPLEMENTED:
From the
above analysis we conclude that RAK Ceramics has high growth prospects as its
sustainability growth is higher and its growth opportunity is positive. So, to
keep up its market opportunity and to sustain in long run, the RAK Ceramics
should try to continue to produce higher quality, effectively usable, new
dimensional innovative products and it has the ability to produce such types of
products. It should keep its high value brand sustainable in long run. As its
operating and free cash flow is positive, so it is in cash cow position. So the
firm should properly use and invest the fund in more productive sectors. Beside
these, the firm’s degree of operating leverage and financial leverage. So it
should be more careful in taking about its financing. As its interest burden is
more sensitive to its ROE, so the firm should be more conscious about its debt
financing. The firm should be more careful about its contingent liabilities.
Very nice post!
ReplyDeleteIt was exceptionally helpful! I am heartily impressed by your blog and learned more from your article, thank you so much for sharing with us. Top Ceramic Brand in Bangladesh keep doing awesome You will get well-informed data about it here.